Impact
Designed self-serve investor dashboards to replace a 3–5 day manual data-request process. Validated with 5 investors, who asked “When can I have this?” at every fidelity.
| My role | Sole UX designer, research → high-fidelity prototypes |
| Team | Project manager, business systems analyst, stakeholder, 12–15 engineers |
| Timeline | Dec 2022 – Feb 2024 |
| Tools | Figma · FigJam · Airtable · Azure DevOps |
| Users | Investors who own loan portfolios serviced by Computershare |
The problem
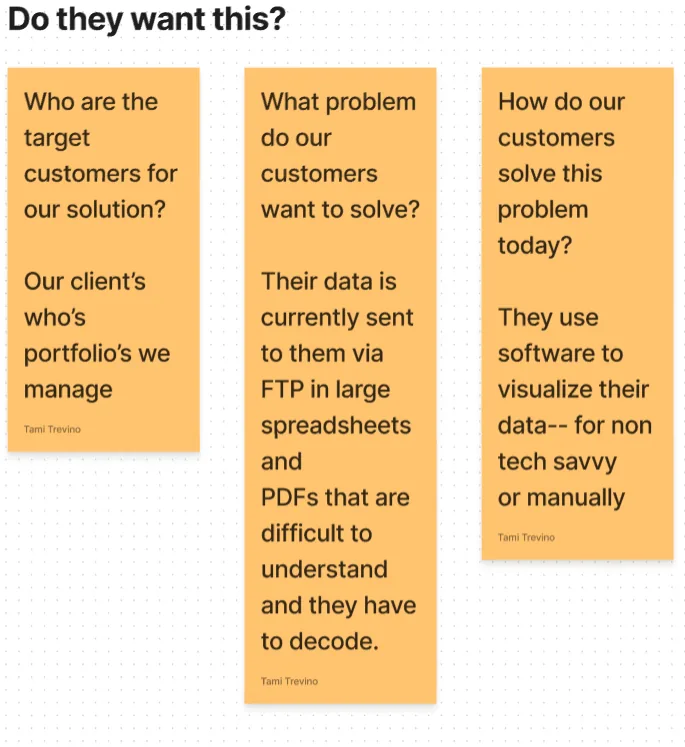
Computershare services mortgage loans for investors. To check on a portfolio, investors emailed a request for each data point. A stakeholder spent 3–5 days building spreadsheets and PDFs, sent over FTP, which were long and hard to read.
Investors wanted answers. They got homework.
How might we give investors clear insight into their portfolios?
My role
This was my first role in finance, so I learned mortgage servicing from scratch: UPB, delinquency buckets, loss mitigation, escrow and HELOCs. Our business systems analyst wrote SQL queries to pull the real data I designed from.
Discovery
1. Mapping what we didn't know. With my PM, I mapped our assumptions: who the customers are, what they need, how they cope today and what could make this fail. I logged every interview and test finding in Airtable, so feedback could be compared and traced to design decisions.
2. Talking to the people closest to the pain. I interviewed the stakeholder who handled investor requests and wrote questions for investors.
3. Reading the artifacts. I studied the spreadsheets and PDFs investors received to learn what they actually asked for.
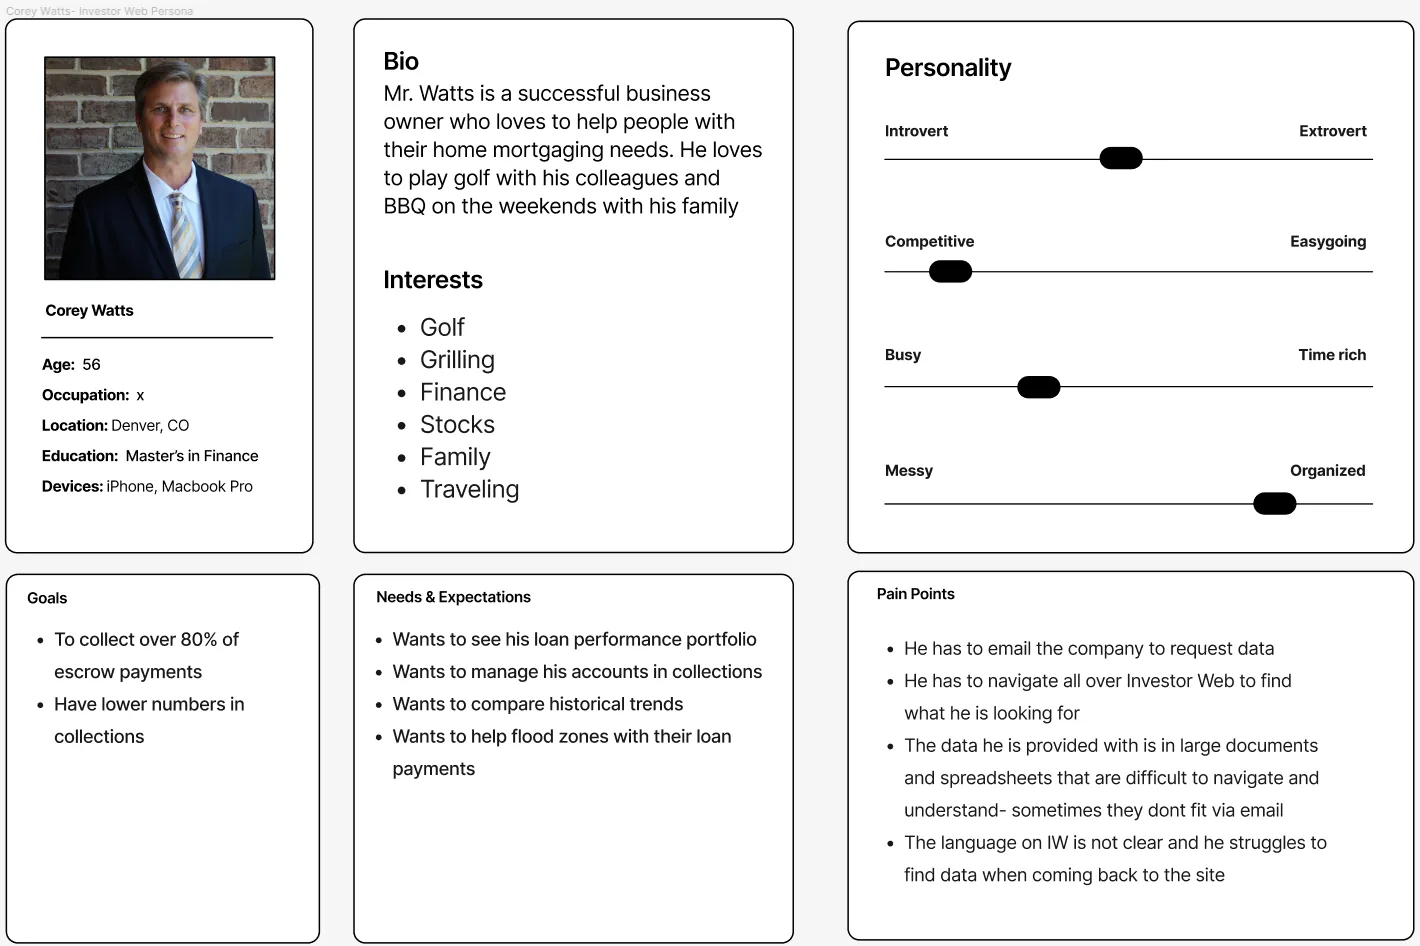
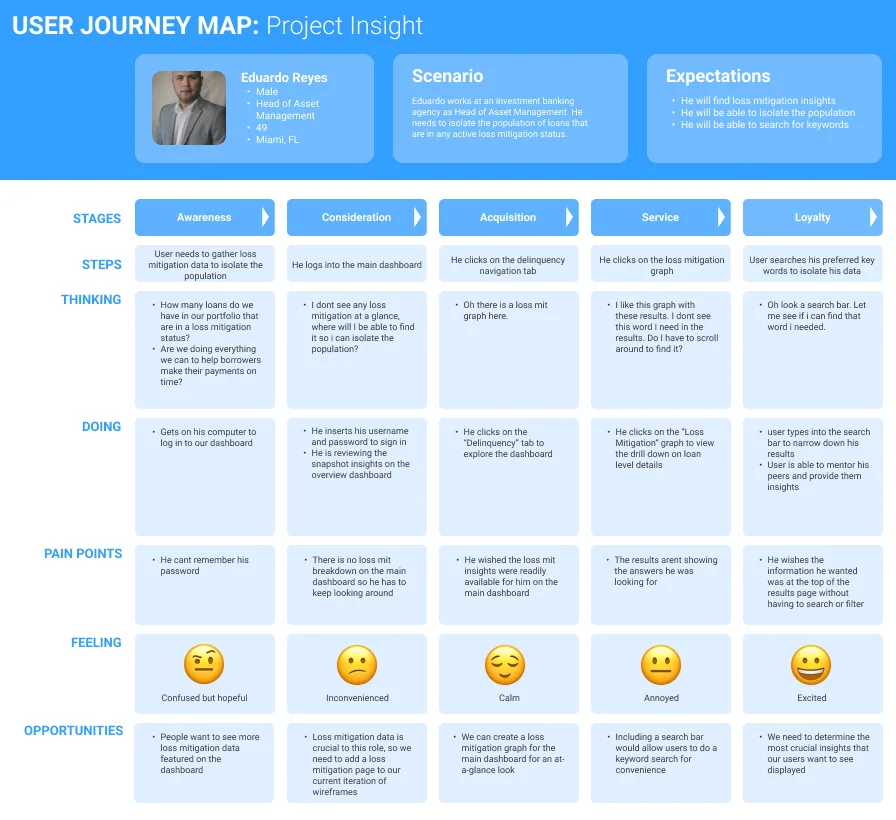
4. Making the user real. I started with a proto-persona, Corey Watts, a 56-year-old banker built from our assumption map. After the interviews, I built Eduardo Reyes, a persona based on a real investor, a head of asset management, and mapped his journey.
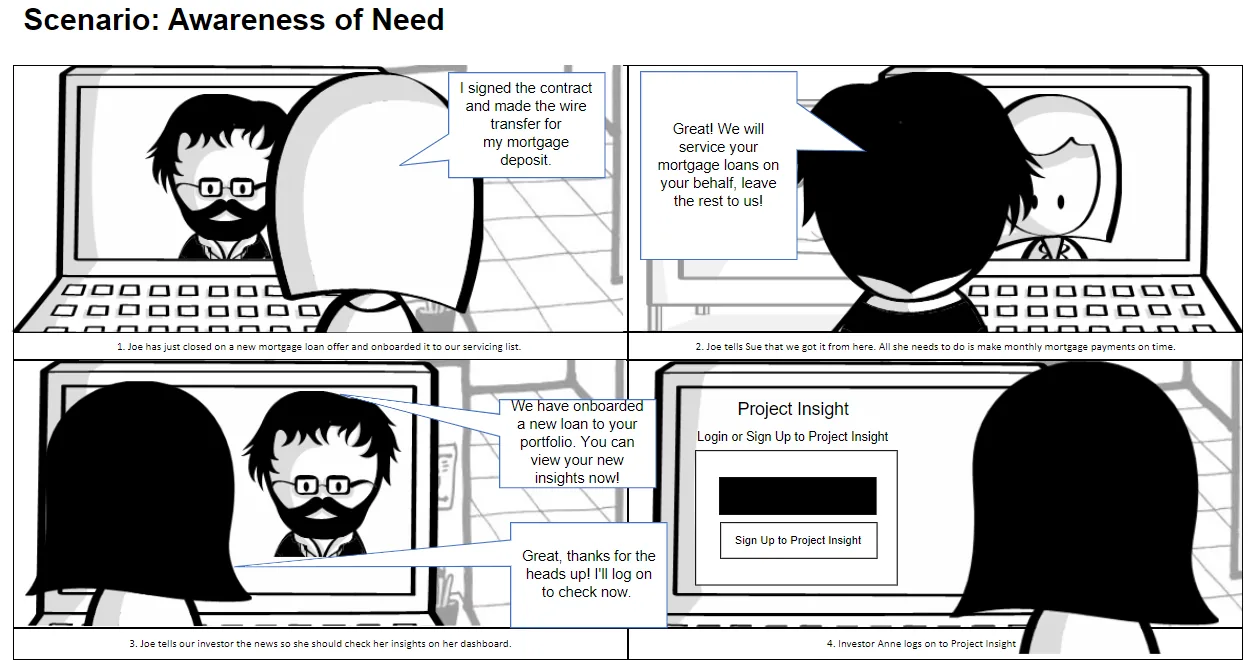
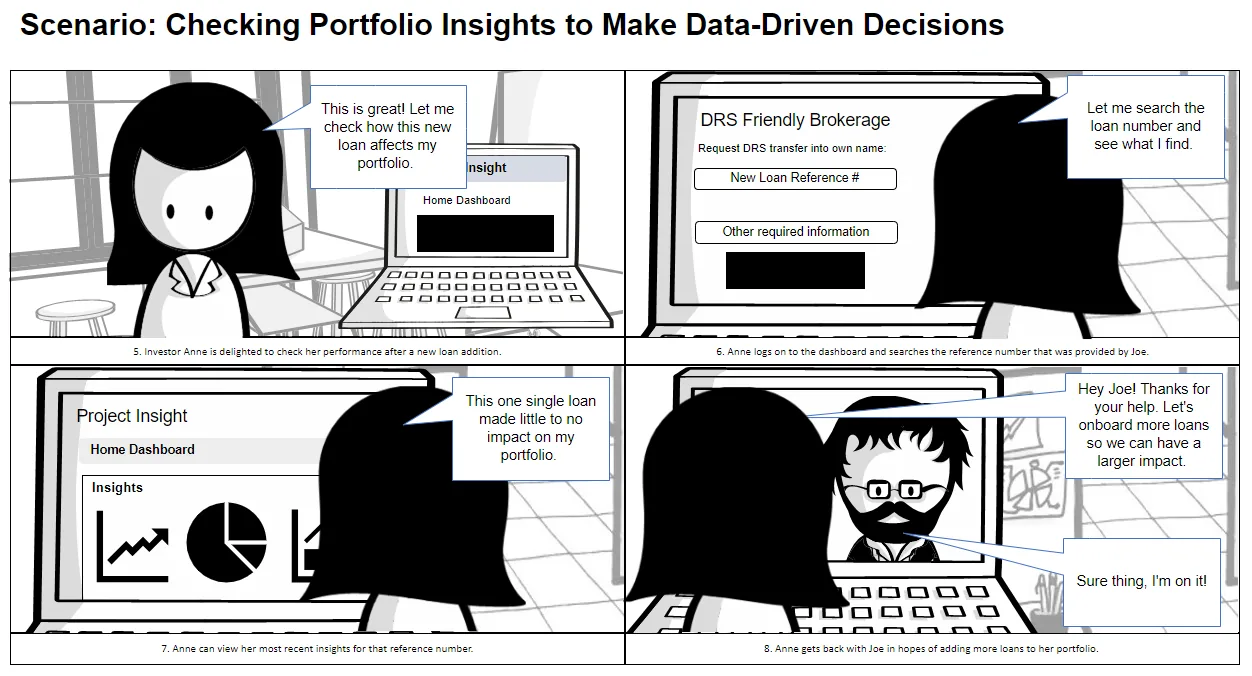
5. Telling the story. Two storyboards showed the experience we were building toward.
Co-designing the dashboard
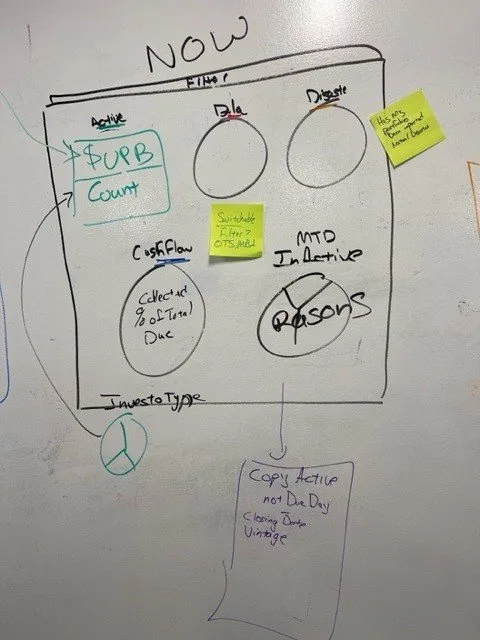
I ran in-person whiteboard sessions with the stakeholder, BSA and project managers. We sketched what investors needed at a glance and what belonged one click deeper: delinquency, cashflow, escrow, entries and exits, and disasters.
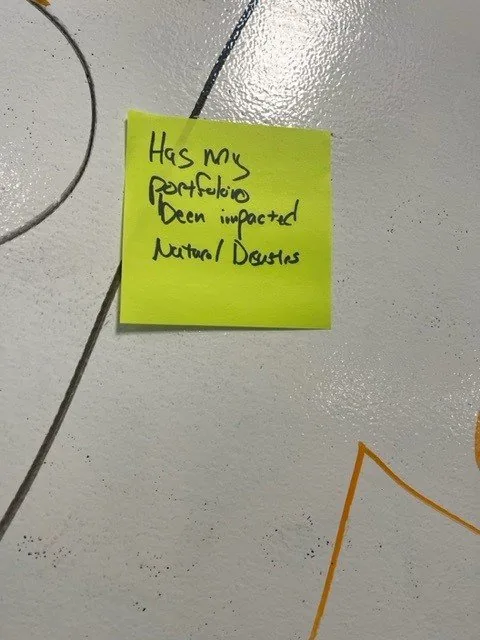
One sticky note changed the product:
"Has my portfolio been impacted by natural disasters?"
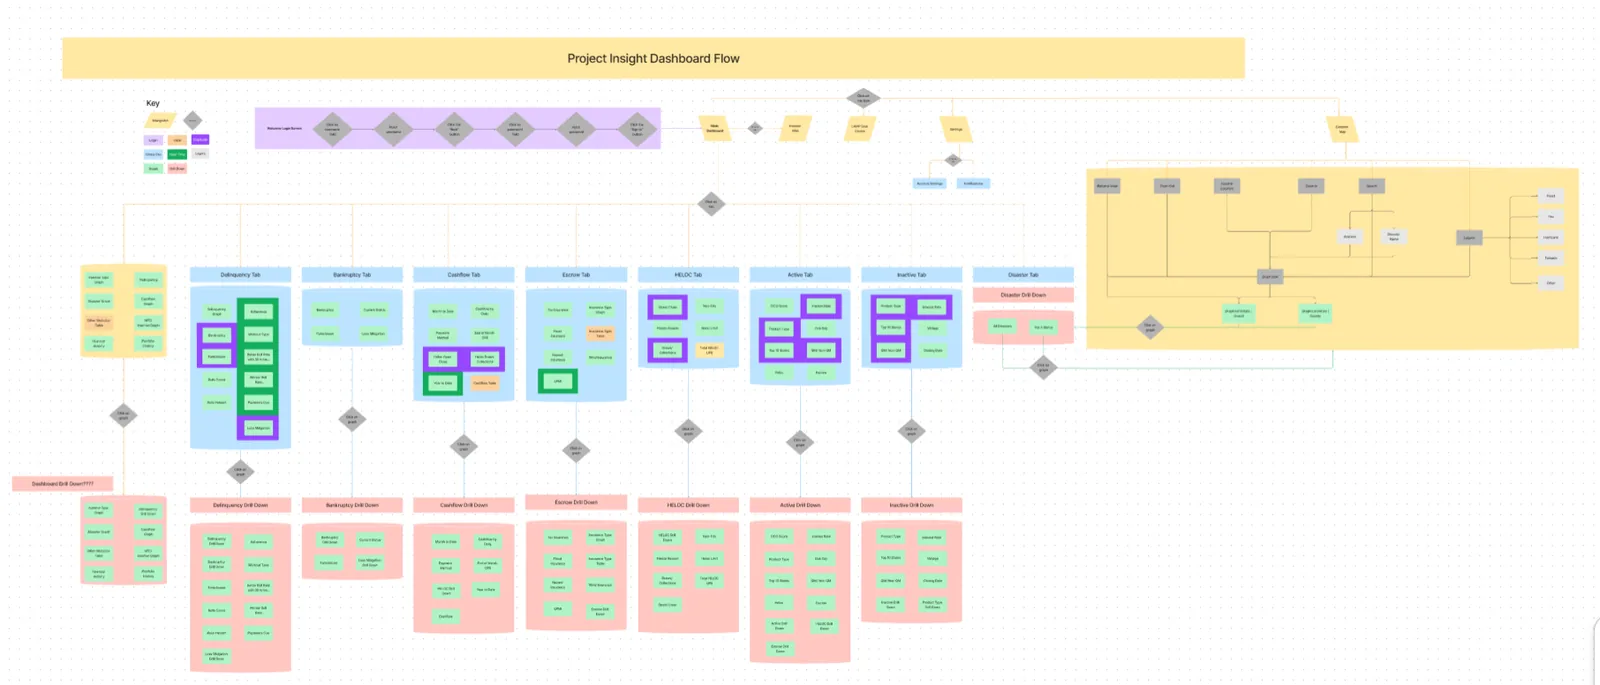
Then I mapped every tab, chart and drill-down.
Testing: one dashboard wasn't enough
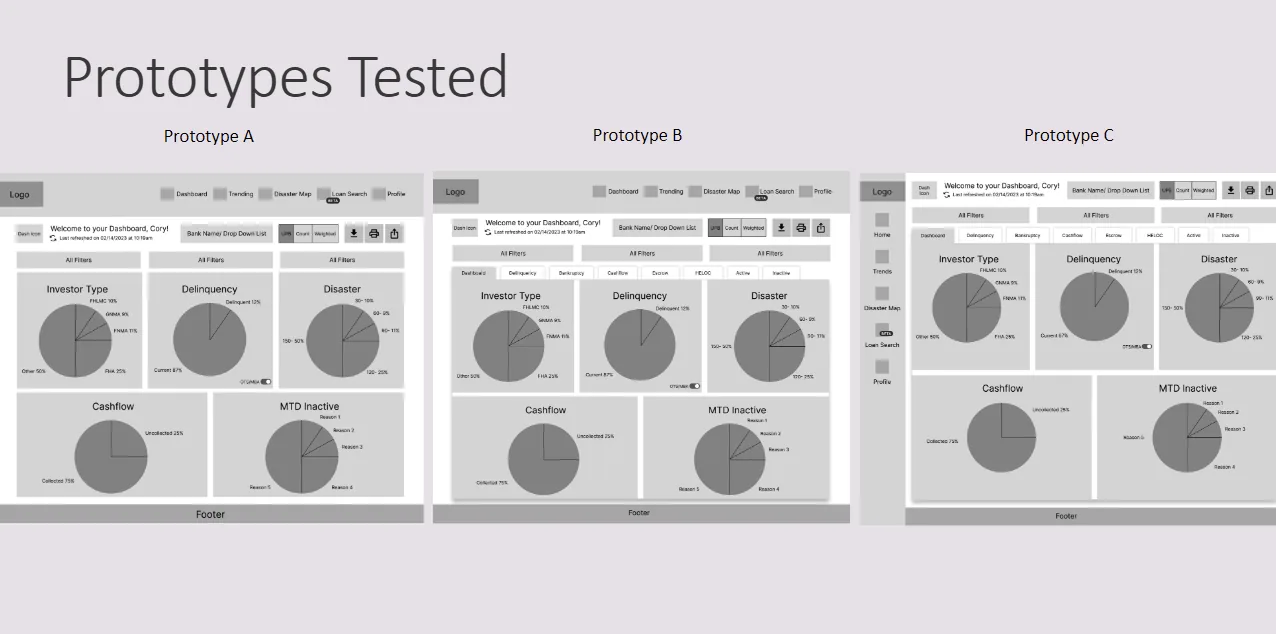
My first concept (Prototype A) was one at-a-glance dashboard built on the data we assumed mattered most.
After 1–2 rounds of low-fidelity testing with 5 investors, the pattern was clear: they wanted more data at a glance, including data we didn't show. We asked what they needed, and their answers became a secondary navigation of focused dashboards.
Prototypes B and C differed only in where that navigation sat: two rows of top tabs, or a side nav plus top tabs.
Finding: investors had no preference. They only cared that the navigation was there.
Decision: we went with the version we already had a component for (side nav + top tabs), which saved design and development time.
Design decisions
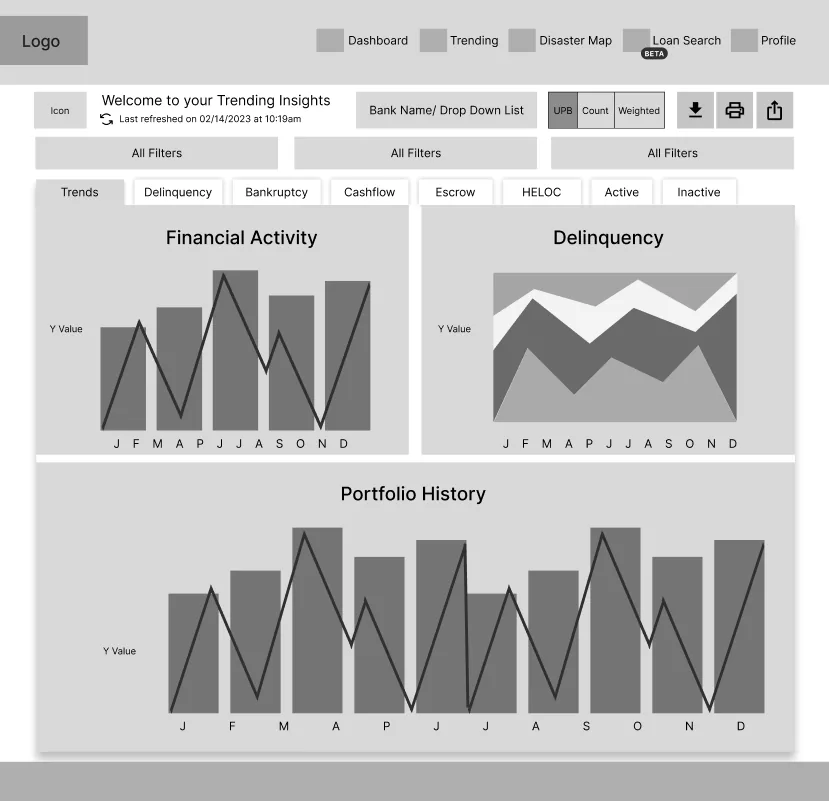
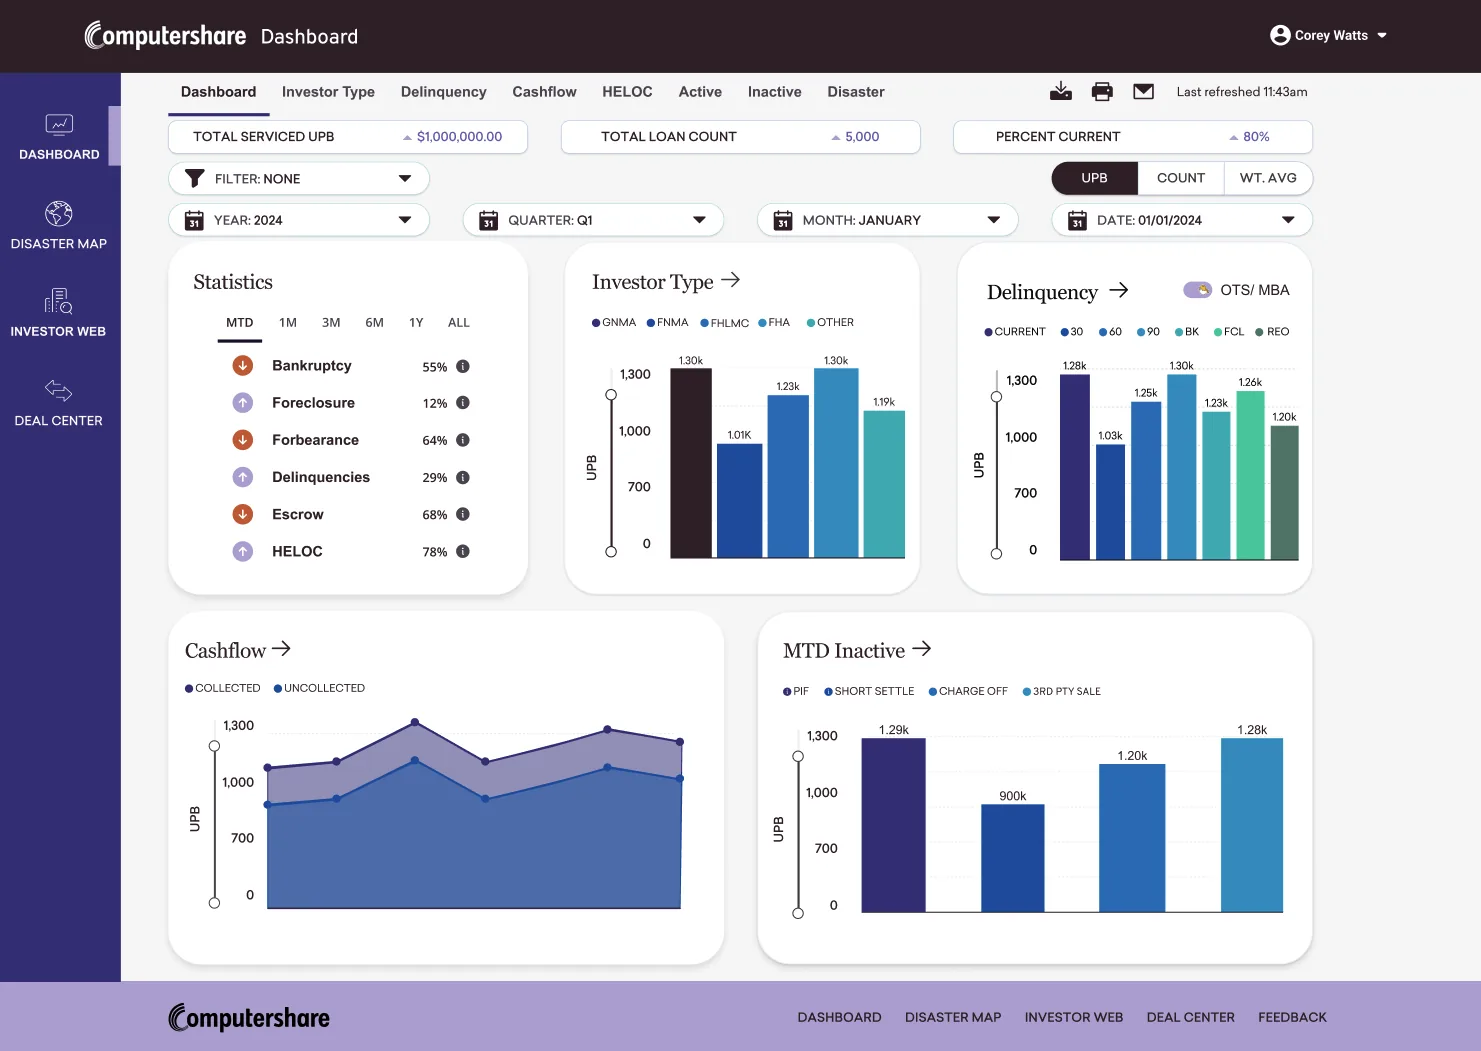
Focused dashboards, not one crowded screen. Main, Investor Type, Delinquency, Cashflow, HELOC, Active, Inactive and Disaster, each with drill-downs.
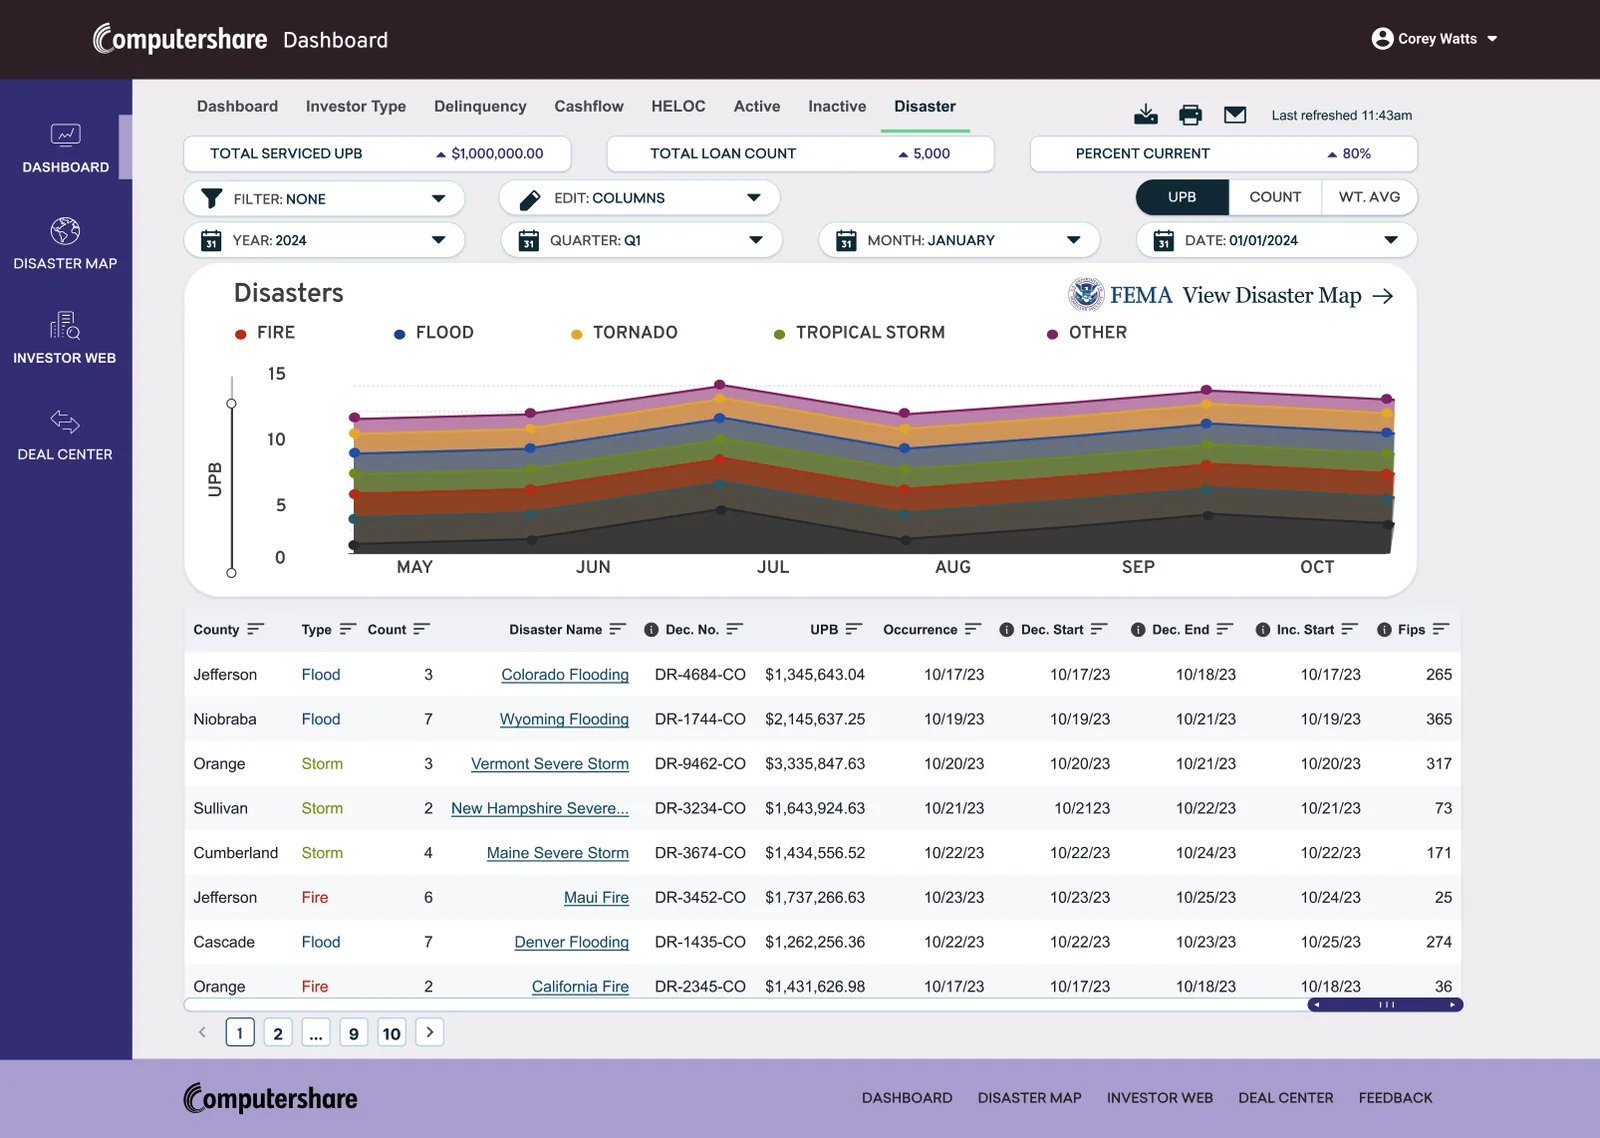
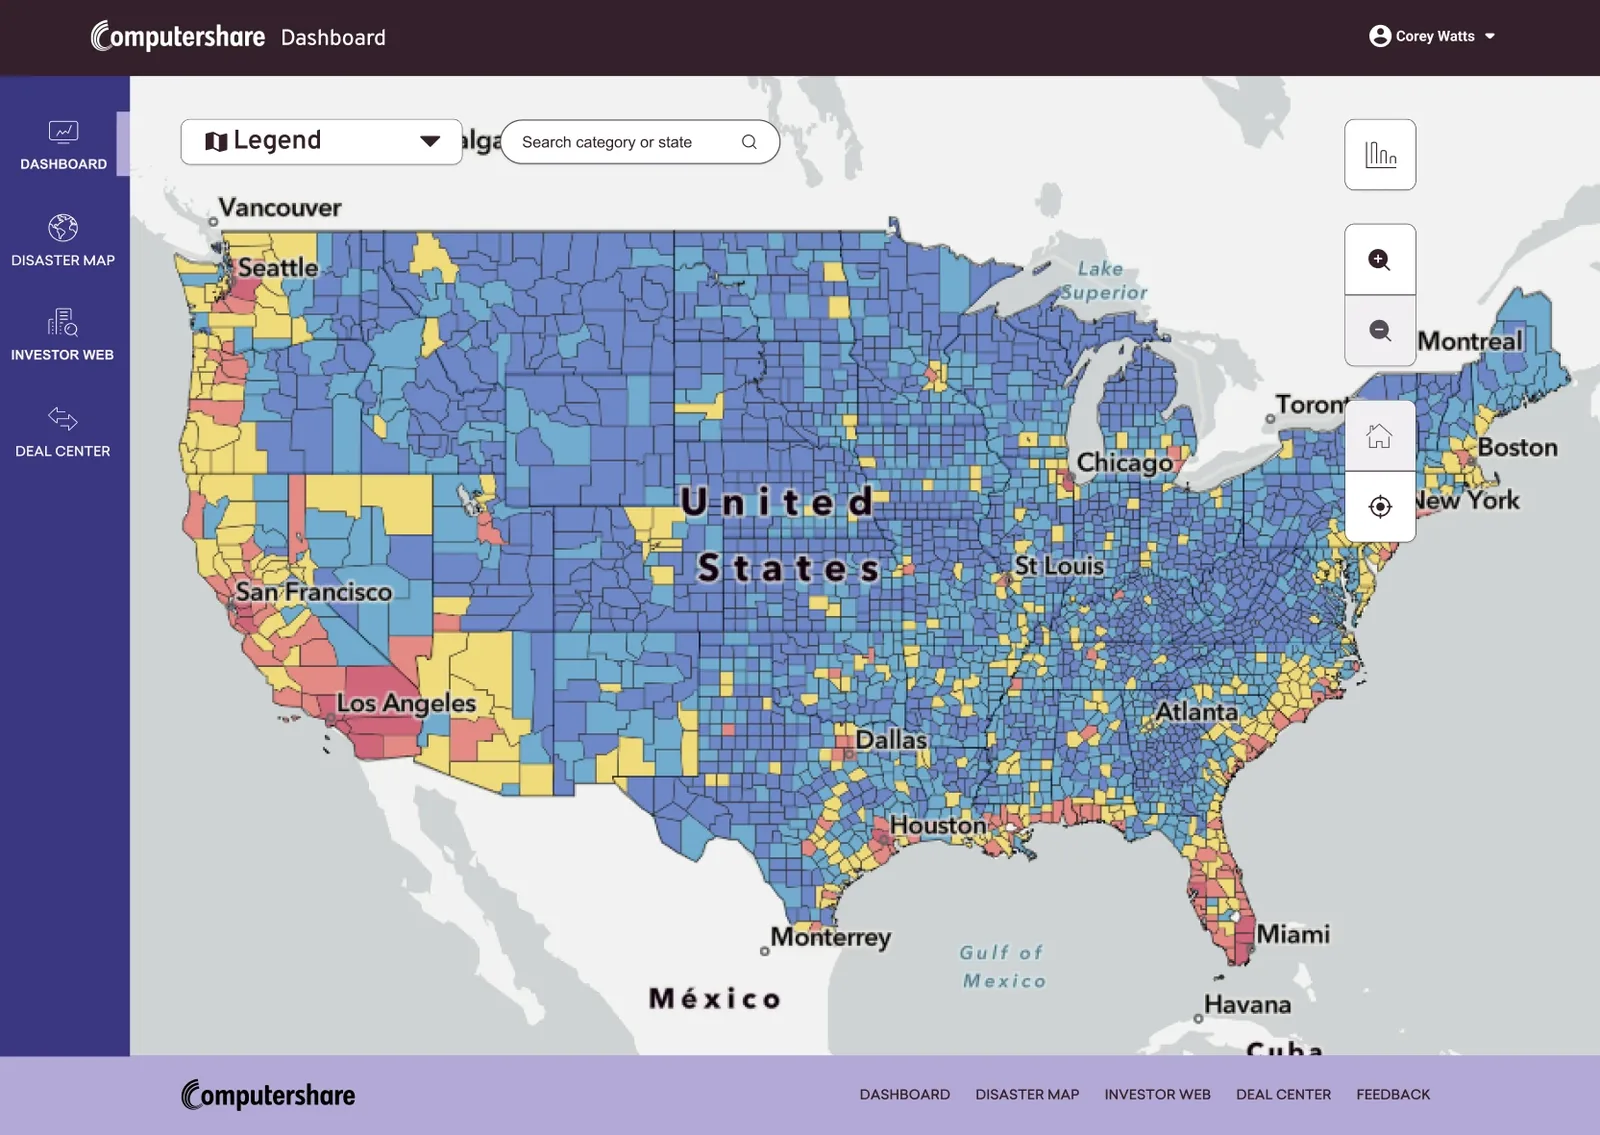
Disasters on their own terms. On the home dashboard, disaster data was noise when nothing was happening. I gave it its own tab with an embedded FEMA disaster risk map, ready when investors need it.
Built for how investors work. A UPB / Count / Weighted-average toggle, date filters, column editing, plus download, print and email.
What we didn't build (yet). I wireframed a loan-level search engine, but we focused on getting the dashboards right first.
Outcome
At every fidelity, investors reacted the same way:
"How can I access this?" "When is this coming out? I need it now."
The designs were validated, and the data team was preparing the backend, when Newrez acquired the company. Newrez already had an investor tool, so Project Insight was cancelled before development.
What I learned
- Test early, even in low fidelity. Investors asked for more data at a glance, which turned one dashboard into a focused suite.
- When users don't care, let effort decide. Reusing an existing nav component saved design and dev time.
- Start with a design system. Tokens, reusable components and documented decisions make the handoff dev-ready from day one.
- Use AI to move faster. I reached high fidelity before AI design tools existed. Today I'd use AI for synthesis, variations and prototyping, and spend the saved time with users.
Data shown is representative; client information has been anonymized to protect confidentiality.